How much higher can interest rates go? A lot higher.
There has recently been a lot of talk in the market, on financial news and elsewhere that basically takes the following form:
Yes, the Fed has to raise short-term interest rates. They will move 50 basis points at each of the next “X” meetings. However, the market has already priced it in, so we have seen peak inflation and we have seen the worst in long-term rates.
This view could not be more wrong.
Medium- and long-term interest rates can and very likely will go a lot higher. The graph below is very informative.
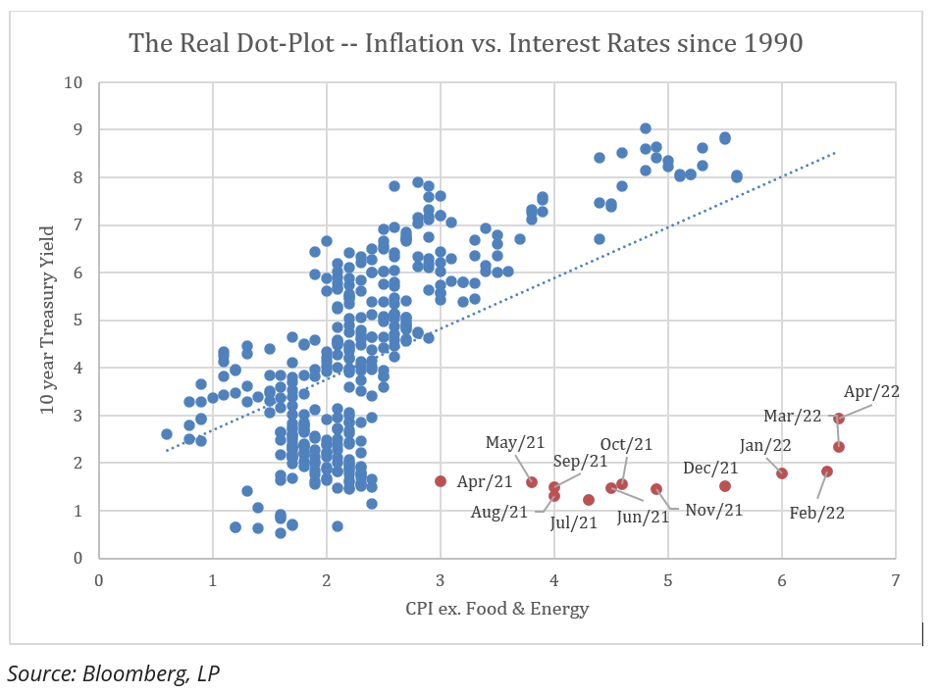
The blue dots show the relationship between inflation (on the horizontal axis) and the 10-year US Treasury Bond yield (vertical axis) since 1990. For the last 30 years or so, there has been a very strong positive relationship between interest rates and CPI excluding food and energy—the Fed’s favorite measure of inflation.
The orange dots show how artificially repressed rates have been as inflation has surged over the last year. As inflation has exploded from 3-4% in early 2021 to the more recent observations approaching 7%, long term rates have barely budged. This has not happened by accident. Instead, it has been a conscious choice by the Federal Reserve. The Fed has continued its extraordinary policy of quantitative easing by continuing to purchase massive amounts of treasury bonds and mortgage backed securities that has taken the Fed’s balance sheet to an almost unimaginable $9 trillion!
Fed Chair Jerome Powell has made it clear to anyone willing to listen, that this policy is coming to an end. In addition to raising the Fed Funds rate aggressively, the Fed will start to unwind its massive balance sheet. When this happens, expect rates to revert to something closer to historic norms.
If rates were to revert to the pattern observed for the last 30 years, we could see 10-year yields well north of 5%, or even 6%. Very few market participants have adopted this view, but a number of very insightful and experienced observers (e.g. Lawrence Summers, Mohamed El-Erian) have begun to express genuine alarm at the possibility.
This outlier view is going to become mainstream over the next several months, and when that happens, the dam will burst, and we will see much, much higher medium- and long -term rates.
For the sake of yours and your clients’ portfolio, it is imperative quickly to take steps to protect against this eventuality. If rates were to retrace even half of the historic relationship to inflation, 10-year yields could reach levels above 6% by this time next year. That implies a loss of value of another 20-30% for many fixed income portfolios, on top of the disastrous performance over the last 12 months.
It would be wise to ignore the voices saying, that “we’ve seen the worst”, “inflation has peaked”, “the Fed will engineer a soft landing,” and worst of all “it’s different this time.” Giving in to these and other soothing nostrums are going to lead to massive losses of wealth.
The Fed has missed the call on one of the most easily foreseeable regime changes in modern economic history. There is nothing they can do to reverse that. They will be playing catchup for years. But investors and their advisors don’t have to compound that error by ignoring the potential for significant losses. Reduce duration now, and hold on tight. It’s going to be a wild ride.
Portfolio Applications
We believe RISR provides an attractive, thematic strategy that provide strong correlation benefits for both fixed income and equity portfolios. It can be utilized as part of a core holding for diversified portfolios or as an overlay to manage the interest rate risk of fixed income portfolios. Alternatively, RISR can be used as a macro hedge against rising interest rates with less exposure to equity beta and negative correlation to fixed income beta. The underlying bonds are all U.S. agency credit that are guaranteed by FNMA, FHLMC or GNMA. There is no financing leverage or explicit short positions that relies on borrowed securities. Also, timing is on our side as the strategy generates current income if interest rates were to remain within a trading range.
Please contact us to explore how RISR can be utilized as a unique tool to adjust your portfolio allocations in the current inflationary environment.
| Yung Lim | Dean Smith | George Lucaci |
|---|---|---|
| Chief Executive Officer | Chief Strategist and Marketing Officer | Global Head of Distribution |
| Chief Investment Officer | RISR Portfolio Manager | |
| ylim@foliobeyond.com | dsmith@foliobeyond.com | glucaci@foliobeyond.com |
| 917-892-9075 | 914-523-2180 | 908-723-3372 |
Investors should consider the investment objectives, risks, charges and expenses carefully before investing. For a prospectus or summary prospectus with this and other information about the Fund, please call (866) 497-4963 or visit our website at www.etfs.foliobeyond.com. Read the prospectus or summary prospectus carefully before investing.
Investments involve risk. Principal loss is possible. Unlike mutual funds, ETFs may trade at a premium or discount to their net asset value. The fund is new and has limited operating history to judge fund risks. The value of MBS IOs is more volatile than other types of mortgage related securities. They are very sensitive not only to declining interest rates, but also to the rate of prepayments. MBS IOs involve the risk that borrowers may default on their mortgage obligations or the guarantees underlying the mortgage-backed securities will default or otherwise fail and that, during periods of falling interest rates, mortgage-backed securities will be called or prepaid, which may result in the Fund having to reinvest proceeds in other investments at a lower interest rate.
The Fund’s derivative investments have risks, including the imperfect correlation between the value of such instruments and the underlying assets or index; the loss of principal, including the potential loss of amounts greater than the initial amount invested in the derivative instrument. The value of the Fund’s investments in fixed income securities (not including MBS IOs) will fluctuate with changes in interest rates. Typically, a rise in interest rates causes a decline in the value of fixed income securities owned indirectly by the Fund. Please see the prospectus for a complete description of principal risks.
Diversification does not eliminate the risk of experiencing investment losses.
Index Definitions
Bloomberg Barclays US Aggregate Bond Index: A broad-based benchmark that measures the investment grade, US dollar-denominated, fixed-rate taxable bond market. The index includes Treasuries, government-related and corporate securities, MBS (agency fixed-rate and hybrid ARM pass-throughs), ABS and CMBS (agency and non-agency).
US Treasury 7-10 Yr Bond Inverse Index: ICE U.S. Treasury 7-10 Year Bond 1X Inverse Index is designed to provide the inverse of the daily return of the ICE U.S. Treasury 7-10 Year Bond Index (IDCOT7). ICE U.S. Treasury 7-10 Year Bond Index tracks the performance of US dollar denominated sovereign debt publicly issued by the US government in its domestic market. Qualifying securities of the underlying index must have greater than or equal to seven years and less than 10 years remaining term to final maturity as of the rebalancing date, a fixed coupon schedule and an adjusted amount outstanding of at least $300 million.
Definitions
Alpha: a return achieved above and beyond the return of a benchmark or proxy with a similar risk level.
Basis Points (bps): Is a unit of measure used in quoting yields, changes in yields or differences between yields. One basis point is equal to 0.01%, or one one-hundredth of a percent of yield and 100 basis points equals 1%.
Beta measures: the volatility of a security or portfolio relative to an index. Less than one means lower volatility than the index; more than one means greater volatility.
Coupon: is the annual interest rate paid on a bond, expressed as a percentage of the bond’s face value.
Convexity: A measure of how the duration of a bond changes in correlation to an interest rate change. The greater the convexity of a bond the greater the exposure of interest rate risk to the portfolio.
CUSIP: An identifier number that stands for the Committee on Uniform Securities Identification Procedures assigned to stocks and registered bonds in the United States and Canada.
Duration: measures a bond price’s sensitivity to changes in interest rates. The longer a bond’s duration, the higher its sensitivity to changes in interest rates and vice versa.
GNMA: Government National Mortgage Association
FNMA: Federal National Mortgage Association
FHLMC: Federal Home Loan Mortgage Corporation
Short Investment (Shorting): is a position that has been sold with the expectation that it will decrease in value, the intention being to repurchase it later at a lower price.
Distributed by Foreside Fund Services, LLC.