RISR Commentary for July, 2022
Performance Summary
The FolioBeyond Rising Rates ETF (ticker: RISR) returned -5.42% based on closing market price (-7.06% based on net asset value or “NAV”) in July. In comparison, the ICET7IN Index (US Treasury 7 Year Bond Inversed Index) returned -2.97% while the Bloomberg Barclays U.S. Aggregate Bond Index ("AGG") returned 2.44% during the same time period.

The performance data quoted represents past performance. Past performance does not guarantee future results. The investment return and principal value of an investment will fluctuate so that an investor’s shares, when sold or redeemed, may be worth more or less than their original cost and current performance may be lower or higher than the performance quoted. Performance current to the most recent month-end can be obtained by calling 866-497-4963. Short term performance, in particular, is not a good indication of the fund’s future performance, and an investment should not be made based solely on returns. Returns beyond 1 year are annualized.
A fund's NAV is the sum of all its assets less any liabilities, divided by the number of shares outstanding. The market price is the most recent price at which the fund was traded. The fund intends to pay out income, if any, monthly. There is no guarantee these distributions will be made.
Total Expense Ratio is 1.01%.
For most recent quarter-end and month-end standardized performance click here.
July Activity
During July, the market concluded that the inflation crisis was over, and that we no longer needed to concern ourselves with the obvious, ongoing, seemingly relentless rise in prices for virtually all goods and services. It was one of the most remarkable examples of “cognitive dissonance” we have observed in the market in many years. The current inflation crisis is most decidedly not over. In reality, the Federal Reserve has barely begun to wage this necessary battle, having raised the Fed Funds rate from a near historic low of 0.25% to only 2.5% by the end of July. By historical standards, this is still a highly accommodative policy rate. Meanwhile, in mid-July headline CPI and PPI were reported at 9.1% and 11.3%, respectively. There is clearly a great deal more work to do in this battle against rising prices.
Nevertheless, the relentless drumbeat in the financial press and among some prominent and influential commentators that the storm had passed, led to a sharp drop in interest rates that saw the 10-year note decline from a yield of 3.02% at the end of June to a cyclical low of 2.65% by the end of July. Stocks also rallied during the month, with the S&P 500 climbing over 9%, which represents a recovery of a big chunk of the 23% selloff seen in the first half of the year. One is reminded of a phrase not-much heard for the last decade or so—"irrational exuberance.”
In light of these dramatic market moves, RISR saw a meaningful drawdown in July. We also contended with redemptions from some investors who decided the market consensus was correct. We vehemently disagree with that conclusion, but if certain investors choose to sell at cyclical lows in the market, that is their prerogative. By way of comparison, several members of FolioBeyond’s management team added to their RISR positions during the month.
There has been a great deal of speculation in the markets as to whether there are further technical forces behind mid-summer rallies in both stock and bond markets. There is some anecdotal evidence supporting this. A Bloomberg News story published in late July stated that several large quantitative commodity trading advisors (CTAs) unwound more than $100bn in bearish market positions in July. CTAs are like hedge funds that trade commodities, including financial futures, rather than securities. If this reporting is accurate, it could explain at least some of the July rally.
Outlook
The question facing investors is where do we go from here? For better or worse, we believe the highly volatile markets seen so far in 2022 will persist for some time. Almost wherever one looks there is uncertainty and risks. We can start with the war in Ukraine. Despite occasional glimmers of hope for progress towards some kind of resolution, there is not really any clear end point in sight for that conflict. Agriculture has been severely disrupted, and the transportation infrastructure needed to get grains and other commodities to port, and from there to export markets, is greatly impaired by the war. Fuels supplies from Russia to Europe are also greatly reduced with impacts on transportation, fertilizer production, and much else. This will continue to put pressure on food supplies, and with winter approaching in Europe, there is very real concern about having access to adequate fuels to heat homes and run factories across the continent. Some forecasts have natural gas spiking to never-before seen levels, and home heating costs in the UK are predicted to literally triple this winter vs the costs paid at the beginning of 2022. Some factories and power plants have been forced to resort to burning coal, or even wood products just to keep the lights on and the air conditioning running. The fact that this summer has been one of the hottest on record across Europe is adding to the pressures. But the real concern is what happens this winter. There is no practical solution being offered for this dangerous situation.
Domestically, the combination of Fed tightening in the short end of the yield curve and rate declines in the longer end, has caused the yield curve to invert—short rates higher than long rates—more than they have in quite some time. A commonly observed measure, the 2s-10s spread[1], continued its near relentless decline in July. It reached a low of -30 basis points[2] at the end of July, and has continued to slide further since then. Inverted yield curves are highly disruptive to financial market functioning. Normally the yield curve is upward sloping, with long term interest rates above short-term interest rates. This is what makes it possible for banks and other financial intermediaries to supply the market with credit. They borrow short, at low rates, and lend long, at higher rates. When the yield curve is inverted, this basic business model breaks down.
It is for this reason, that inverted yield curves are a policy maker’s nightmare, and such episodes are usually short lived. The graph below shows the most recent historical yield curve inversions.
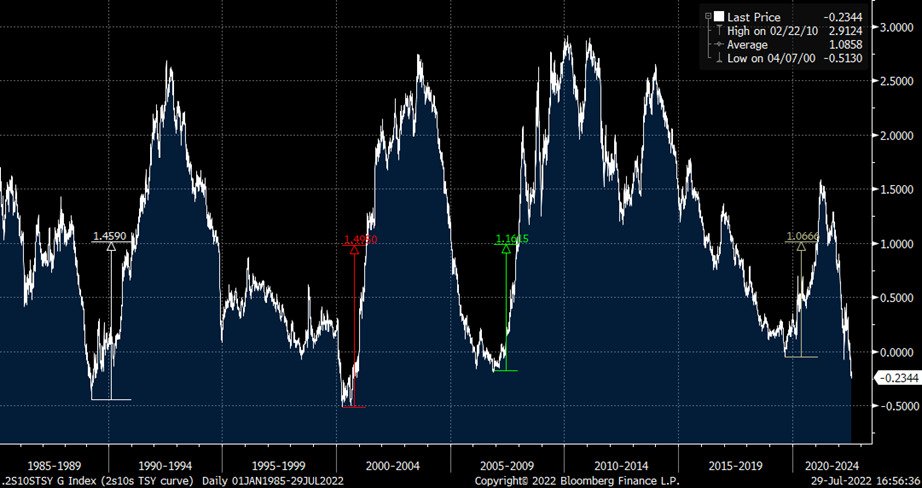
Source: Bloomberg, LP
What the chart clearly shows is that periods of inverted yield curves tend to be reversed rather quickly. In each case since 1985, the 2s-10s spread reverted to a positive differential of at least 100 basis points within 12-18 months, and in most cases was back to +200 basis points not long after.
In other words, while many market observers view an inverted yield curve as a powerful negative signal for economic growth, in terms of RISR’s thesis—medium- and long-term rates moving higher—the historical record is highly supportive.
We have repeatedly pointed to the housing market as a bellwether for the future path of the economy. Housing represents the single largest assets and the single largest budget item for most American households. The housing market saw further deterioration in July. Nearly every key metric, from mortgage applications to housing starts, to existing and new home sales, declined in July. The good news is that after a more than decade-long boom, Americans have built up significant equity in their homes. Consequently, we can expect to see further weakness in the housing market, without necessarily seeing a repeat of the 2007-08 housing crisis that brought the financial system to its knees.
Another significant market development in July was a growing consensus in the public position for many Federal Reserve speakers in favor of fighting inflation as a priority over avoiding an economic slowdown. For several months, we have decried the mixed messaging coming from a range of Fed speakers on this point. We believe it has added to market volatility, and ultimately has made the Fed’s job of reducing inflation harder than it needed to be. So, we welcome this growing consensus as unity on messaging. So far, the market is still skeptical, but if the Fed can be resolute and consistent in its messaging, eventually they will overcome market doubts. The expression “Don’t Fight the Fed” has become a wise maxim for a reason.
Finally, we want to make the case that despite the drawdown in July, we believe RISR still can perform a valuable role for a broad range of investors, even if rates stabilize in this trading range for several months or longer. The RISR ETF has low correlation to equities and the broader fixed income market, and has much lower volatility than a number of other product investors may be considering to help manage risk in their portfolio more broadly.
Furthermore, it is important to note that our investments generate a meaningful amount of current income. The fund distributed a dividend of $0.125/share in July, and so far in 2022, we have paid $0.388/share in dividends. This current investment income provides a meaningful supplement to investor returns, that should persist even if the Fed delays getting on with the job of raising rates to tame inflation.
As we have noted previously, our strategy aims to hold a negative 10-year duration. That is, the fund is managed to experience price movements of 10x the change in interest rates. Consequently, if rates were to rise 100bps, we would expect to see gains in NAV per share of around 10%. A 200 bps rise could see a 20% gain, and so on. Since the inception of the fund, our actual rate sensitivity has been even greater than that, due to security selection, and mortgage spread variability. We hope to be able to outperform our baseline goals, but even if we only achieve our targets, RISR investors could see material further gains if rates increase as we believe they will. Our firm belief is this trade has a long way to run. And even if it takes the Fed longer to get on with the task at hand, the benefits of holding RISR can be substantial for a broad class of investors. We would be pleased to discuss your particular situation to explore how best to incorporate RISR into your overall portfolio.
Footnotes
[1] This is simply the yield on 10-year government notes minus the yield on 2-year government notes.
[2] A basis point is 1/100th of a percent. 30 basis points is equal to 0.30%.
Portfolio Applications
We believe RISR provides an attractive, thematic strategy that provide strong correlation benefits for both fixed income and equity portfolios. It can be utilized as part of a core holding for diversified portfolios or as an overlay to manage the interest rate risk of fixed income portfolios. Alternatively, RISR can be used as a macro hedge against rising interest rates with less exposure to equity beta and negative correlation to fixed income beta. The underlying bonds are all U.S. agency credit that are guaranteed by FNMA, FHLMC or GNMA. There is no financing leverage or explicit short positions that relies on borrowed securities. Also, timing is on our side as the strategy generates current income if interest rates were to remain within a trading range.
Please contact us to explore how RISR can be utilized as a unique tool to adjust your portfolio allocations in the current inflationary environment.
| Yung Lim | Dean Smith | George Lucaci |
|---|---|---|
| Chief Executive Officer | Chief Strategist and Marketing Officer | Global Head of Distribution |
| Chief Investment Officer | RISR Portfolio Manager | |
| ylim@foliobeyond.com | dsmith@foliobeyond.com | glucaci@foliobeyond.com |
| 917-892-9075 | 914-523-2180 | 908-723-3372 |
Investors should consider the investment objectives, risks, charges and expenses carefully before investing. For a prospectus or summary prospectus with this and other information about the Fund, please call (866) 497-4963 or visit our website at www.etfs.foliobeyond.com. Read the prospectus or summary prospectus carefully before investing.
Investments involve risk. Principal loss is possible. Unlike mutual funds, ETFs may trade at a premium or discount to their net asset value. The fund is new and has limited operating history to judge fund risks. The value of MBS IOs is more volatile than other types of mortgage related securities. They are very sensitive not only to declining interest rates, but also to the rate of prepayments. MBS IOs involve the risk that borrowers may default on their mortgage obligations or the guarantees underlying the mortgage-backed securities will default or otherwise fail and that, during periods of falling interest rates, mortgage-backed securities will be called or prepaid, which may result in the Fund having to reinvest proceeds in other investments at a lower interest rate.
The Fund’s derivative investments have risks, including the imperfect correlation between the value of such instruments and the underlying assets or index; the loss of principal, including the potential loss of amounts greater than the initial amount invested in the derivative instrument. The value of the Fund’s investments in fixed income securities (not including MBS IOs) will fluctuate with changes in interest rates. Typically, a rise in interest rates causes a decline in the value of fixed income securities owned indirectly by the Fund. Please see the prospectus for a complete description of principal risks.
Diversification does not eliminate the risk of experiencing investment losses.
Index Definitions
Bloomberg Barclays US Aggregate Bond Index: A broad-based benchmark that measures the investment grade, US dollar-denominated, fixed-rate taxable bond market. The index includes Treasuries, government-related and corporate securities, MBS (agency fixed-rate and hybrid ARM pass-throughs), ABS and CMBS (agency and non-agency).
US Treasury 7-10 Yr Bond Inverse Index: ICE U.S. Treasury 7-10 Year Bond 1X Inverse Index is designed to provide the inverse of the daily return of the ICE U.S. Treasury 7-10 Year Bond Index (IDCOT7). ICE U.S. Treasury 7-10 Year Bond Index tracks the performance of US dollar denominated sovereign debt publicly issued by the US government in its domestic market. Qualifying securities of the underlying index must have greater than or equal to seven years and less than 10 years remaining term to final maturity as of the rebalancing date, a fixed coupon schedule and an adjusted amount outstanding of at least $300 million.
S&P 500 (Standard & Poors 500): The S&P 500 Index represents a market-capitalization weighted index of 500 leading publicly traded companies in the U.S, as defined by the Standard & Poors corporation.
Definitions
Alpha: a return achieved above and beyond the return of a benchmark or proxy with a similar risk level.
Basis Points (bps): Is a unit of measure used in quoting yields, changes in yields or differences between yields. One basis point is equal to 0.01%, or one one-hundredth of a percent of yield and 100 basis points equals 1%.
Beta measures: the volatility of a security or portfolio relative to an index. Less than one means lower volatility than the index; more than one means greater volatility.
Coupon: is the annual interest rate paid on a bond, expressed as a percentage of the bond’s face value.
Convexity: A measure of how the duration of a bond changes in correlation to an interest rate change. The greater the convexity of a bond the greater the exposure of interest rate risk to the portfolio.
CUSIP: An identifier number that stands for the Committee on Uniform Securities Identification Procedures assigned to stocks and registered bonds in the United States and Canada.
Duration: measures a bond price’s sensitivity to changes in interest rates. The longer a bond’s duration, the higher its sensitivity to changes in interest rates and vice versa.
GNMA: Government National Mortgage Association
FNMA: Federal National Mortgage Association
FHLMC: Federal Home Loan Mortgage Corporation
Producer Price Index (PPI) : is a family of indexes that measures the average change over time in selling prices received by domestic producers of goods and services. PPIs measure price change from the perspective of the seller. This contrasts with other measures, such as the Consumer Price Index (CPI), that measure price change from the purchaser's perspective. Sellers' and purchasers' prices may differ due to government subsidies, sales and excise taxes, and distribution costs.
Short Investment (Shorting): is a position that has been sold with the expectation that it will decrease in value, the intention being to repurchase it later at a lower price.
Distributed by Foreside Fund Services, LLC.